
Saturday
Oct282017
Cedar Beach Pizza
Cedar Beach Pizza is closed until November 22. We anticipate a more regular schedule through mid January. Hope to hear from you in late November.
Virginia and Andy Lamb
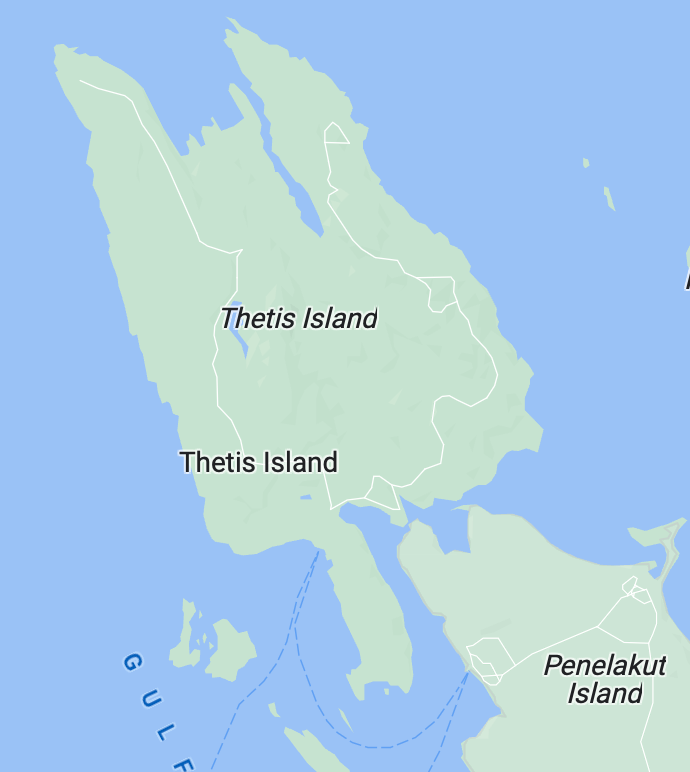
Thetis Island, BC
Canada
49oN x 123o40'W
 Horse Tails
*****
Thetis Island Community Association
 *****
*****

*****
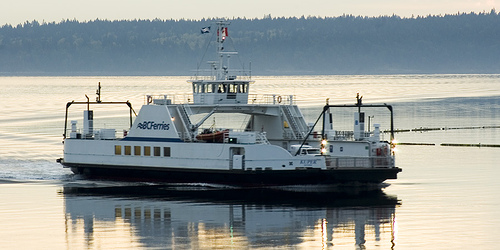
Busy Ferry Schedule: Capernwray

Who's Who of Thetis Pets Registry

*****
Welcome to thetisposts.ca
Feel free to send us bits & pieces of information and interest, photos to share and notices of upcoming events etc.
Use the contact page or e-mail us directly.
Cedar Beach Pizza is closed until November 22. We anticipate a more regular schedule through mid January. Hope to hear from you in late November.
Virginia and Andy Lamb
The deadline for all contributions to the Winter issue of the Quarterly is November 10th. If it's possible you might run past that date by a day or two, please be sure that I at least know about it by the 10th. This deadline also applies to all ads - additions, changes, or deletions. This time, please send everything to Veronica at the addresses below, and as always, thank you all for taking the time to do this!
or P.O. Box 6-15,
or call at 250 246 1509

This is another reminder to the person who borrowed The Unwomanly Face of War, to please return it.
The library patron it was reserved for is impatiently awaiting its return.
Thank you.
Celine

We have two new 3.78 liters cans of sikens Cetol 1RE. Will sell for $70.00 each' retail price $79.00 +tax.
Call Ken or Genny Redman 250-246-2465.
Approx. 6-foot piece of 6 inch Class-A chimney ~ old, used is just fine ~ for my fishing shack on Quadra.
Donovan 246 4695
Thank you all for your patience in waiting to get a start on your outdoor burning. However, will not be issuing burn pile/yard waste permits this month, despite the torrential "atmospheric river" weather change.
Starting November 1st open burning can commence and no permit is required, although Provincial regulations for size and safety must be followed.
Some islanders have been asking why we are not opening up to burn piles yet. The fire hazard matrix is not based solely on rainfall. One of our apparatus is off-island for needed repairs and several of our volunteer members who made themselves available all through the Extreme period are now away on damp holidays.
We are always looking for new, committed members to join the department. Please contact chief11@telus.net if interested.
TIVFD

2 tempered glass panels 34 x 64 and 1/8” thick. Greenhouse? Cold Frame?
Lots of things you can use them for!
Pat English 250-246-9899.
Printer/Scanner for sale $50.
Epson Workforce 500 printer/scanner plus full set of spare ink cartridges and USB cable.
Cartridges are worth over $100 alone. Pat English 250-246-9899.
· Aluminum shelving brackets (more than 80) & 7-foot wall mounts (4): $50 or best offer
· 3½ inch x 8-foot aluminum studs (5): $10
· New 4 foot fluorescent plug in light: $15
Please contact paulduncanvictoria@shaw.ca to view.
Great article about Nicole Chiasson's new venture ~ drop by for a beverage and a hello!

Forbes Hall Soup's On from 11:30 AM to 1:00 PM
but do come early since we sometimes run out!
Still just $5.00 - This week's Soup's On menu includes:
Piccole Orecchie Alla Fina Del Giardino Soup
"little ears at the end of the garden"
AKA Italian Vegetarian with Pasta
along with Pane Rosmarino (Rosemary Buns)
Baked Goods include Quadrate al Limone/Lemon Squares
and some sticky deliziosa caramel cookies
Pot of Gold Coffee (thanks Mattie Bannister for the early
morning deliveries!) and a Variety of Teas
After guests are served, take out will be for sale.
Assente dalla cucina -MISSING FROM THE KITCHEN
Our largest pot and it's lid are still AWOL. We really
need it to be returned for our wonderful volunteer
Soup Cooks to use!
Bridge - at 1:00 PM in the Library
Scottish Country Dancing at 4:00 PM

Sam is looking for a new home. Loving playful and full of energy.
Please call Ginny Arrowsmith @ 250-246-5336
or cell. 250-537-7030

 Post a Comment →